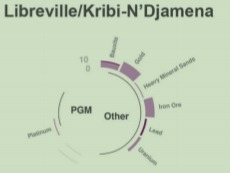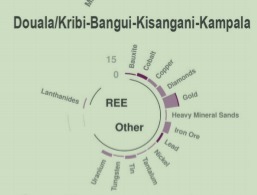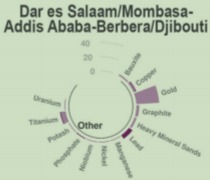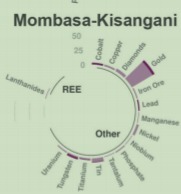
The corridors

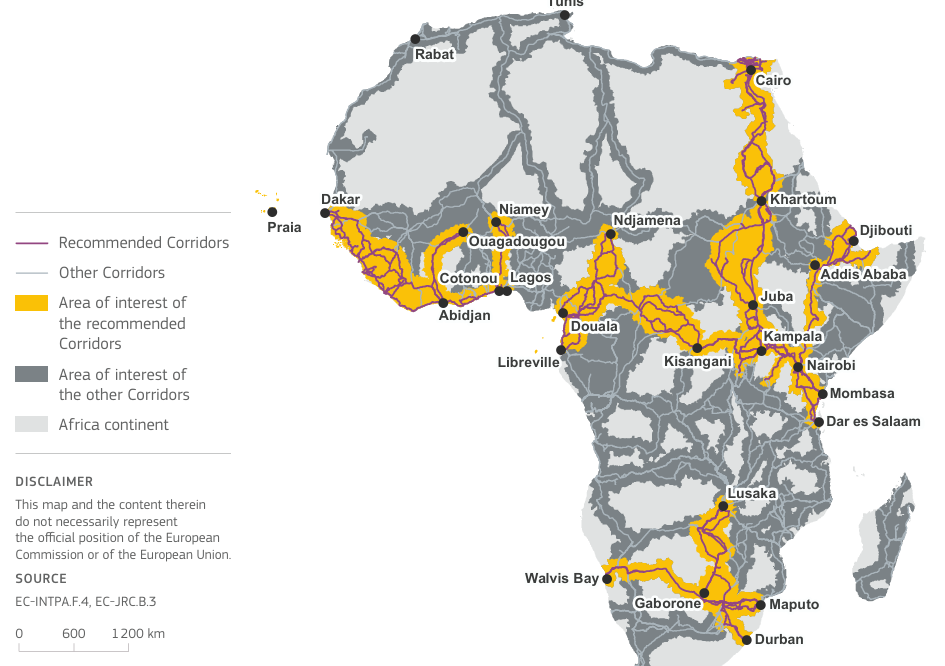
Africa, curved into careful 11 Strategic Corridors

In theory the Strategic Corridors come across as a strategy intended to facilitate Africa–Europe trade and diversified value chains. In practice, however, the 11 corridors — including the yet to be developed 12th corridor — follow a familiar pathway: extraction and pathways for export of raw materials.

Sources

How the corridors were mapped

The primary source is the European Commission's CUSA / JRC strategic corridors report. Supporting coverage of the launch and the eleven-corridor shortlist is linked below.

Open the CUSA Corridor Report page →
Western Africa
Central Africa
Eastern Africa
Southern Africa
Northern & Eastern Africa
01

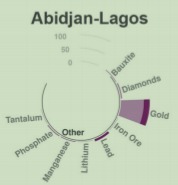
Abidjan–Lagos

Western Africa

A coastal highway and logistics corridor linking five West African capitals — narrowed from 55 CUSA candidates using 140 quantitative indicators.

130 mining properties (CUSA Table 2)

Côte d'IvoireGhanaTogoBeninNigeria
Minerals mapped
  • Gold
  • Iron ore
  • Diamonds
  • Bauxite
Full corridor brief →
02

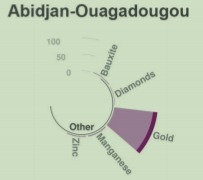
Abidjan–Ouagadougou

Western Africa

Rail and road corridor from the Ivorian coast to landlocked Burkina Faso.

138 mining properties (CUSA Table 2)

Côte d'IvoireBurkina Faso
Minerals mapped
  • Gold
  • Manganese
  • Zinc
  • Iron ore
  • Bauxite
Full corridor brief →
03

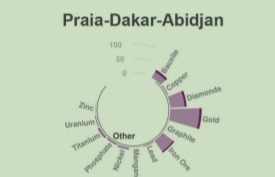
Maritime-and-land connectivity axis along the Atlantic edge of West Africa.

282 mining properties (CUSA Table 2)

Cabo VerdeSenegalGambiaGuinea-BissauGuineaSierra LeoneLiberiaCôte d'Ivoire
Minerals mapped
  • Gold
  • Iron ore
  • Diamonds
  • Phosphate
  • Zinc
  • Uranium
  • Titanium
  • Nickel
Full corridor brief →
04

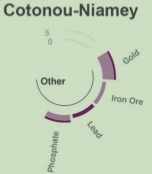
Cotonou–Niamey

Western Africa

Short corridor linking Benin's port of Cotonou to Niger's capital.

15 mining properties (CUSA Table 2)

BeninNiger
Minerals mapped
  • Gold
  • Iron ore
  • Lead
  • Phosphate
Full corridor brief →
08

Mombasa–Kisangani

Eastern Africa

Indian Ocean to Congo Basin corridor for mineral and agricultural evacuation.

87 mining properties (CUSA Table 2)

KenyaUgandaRwandaDR Congo
Minerals mapped
  • REE
  • Iron ore
  • Lead
  • Manganese
  • Nickel
  • Gold
Full corridor brief →
10

Primary evacuation route for the Copperbelt's copper and cobalt.

596 mining properties (CUSA Table 2)

South AfricaBotswanaZimbabweZambiaDR Congo
Minerals mapped
  • PGM
  • Lanthanides
  • Copper
  • Cobalt
  • Iron ore
  • Gold
Full corridor brief →
11

Cairo–Khartoum–Juba–Kampala

Northern & Eastern Africa

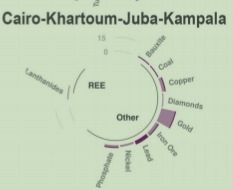
Nile Basin corridor connecting North and East Africa — framed for future expansion around mining and battery-material prospects.

37 mining properties (CUSA Table 2)

EgyptSudanSouth SudanUganda
Minerals mapped
  • Gold
  • Iron ore
  • Copper
  • Diamonds
  • REE

Listed "to be developed further." Mining properties nearby encourage future expansion.

Full corridor brief →
12

Lobito–Kolwezi–Lubumbashi–Solwezi–Ndola

Southern AfricaFlagship priority

Atlantic-facing rail corridor from Lobito through the DRC Copperbelt to Zambia — the EU and US flagship for critical minerals evacuation.

225 mining properties (CUSA Table 2)

AngolaDR CongoZambia
Minerals mapped
  • Copper
  • Cobalt
  • Gold
  • Iron ore

The EU–US flagship priority: a 1,300 km railway built to evacuate copper and cobalt to the Atlantic.

Full corridor brief →
02

Dakar–Bamako

Western Africa

Rail and road corridor from the Atlantic to landlocked Mali — critical for iron ore, gold and cotton evacuation.

64 mining properties (CUSA Table 2)

SenegalMali
Full corridor brief →
04

756 km standard-gauge line and parallel highway — the primary export outlet for landlocked Ethiopia's 120M-person market.

45 mining properties (CUSA Table 2)

DjiboutiEthiopia
Full corridor brief →
05

LAPSSET

Eastern Africa

Lamu Port–South Sudan–Ethiopia Transport corridor: 2,000 km of road, rail, pipeline and fibre from the Kenyan coast into the Horn.

46 mining properties (CUSA Table 2)

KenyaEthiopiaSouth Sudan
Full corridor brief →
06

Northern Corridor

Eastern Africa

Mombasa–Kigali–Bujumbura–Goma road, rail and fibre spine serving the East African Community's 200M people.

169 mining properties (CUSA Table 2)

KenyaUgandaRwandaBurundiDRC
Full corridor brief →
07

Central Corridor

Eastern Africa

Dar es Salaam–Kigali–Bujumbura–Kinshasa multimodal corridor competing with the Northern Corridor for East African transit share.

91 mining properties (CUSA Table 2)

TanzaniaRwandaBurundiDRCUganda
Full corridor brief →
08

The AU's flagship trans-African highway, folded into Global Gateway financing arrangements segment by segment.

317 mining properties (CUSA Table 2)

EgyptSudanSouth SudanUgandaKenyaTanzaniaZambiaZimbabweSouth Africa
Full corridor brief →
09

Maputo Corridor

Southern Africa

Johannesburg–Maputo road, rail and gas pipeline corridor — one of Africa's most industrialised transit routes.

107 mining properties (CUSA Table 2)

South AfricaEswatiniMozambique
Full corridor brief →
10

North–South Corridor

Southern Africa

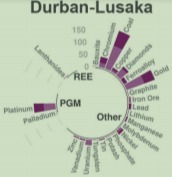
Durban–Lusaka–Lubumbashi–Dar es Salaam artery: the primary evacuation route for the Copperbelt.

192 mining properties (CUSA Table 2)

South AfricaZimbabweZambiaDRCTanzania
Full corridor brief →

Five of the eleven are mineral resource corridors holding 49% of mapped mining properties. In the end the corridors mitigate the risk of supply disruptions of critical raw materials for the EU.

What remains largely unsaid is that these corridors will be developed with debt — financial outlays that African countries repay for up to 50 years.

The EU flaunts the grant elements of the projects. But it conveniently hides the fact that all grant elements are mainly directed at subsidies for European companies to tip any “open tenders” toward European corporations — either by absorbing interest charged by European Development Banks, or direct financing in the form of blended finance.

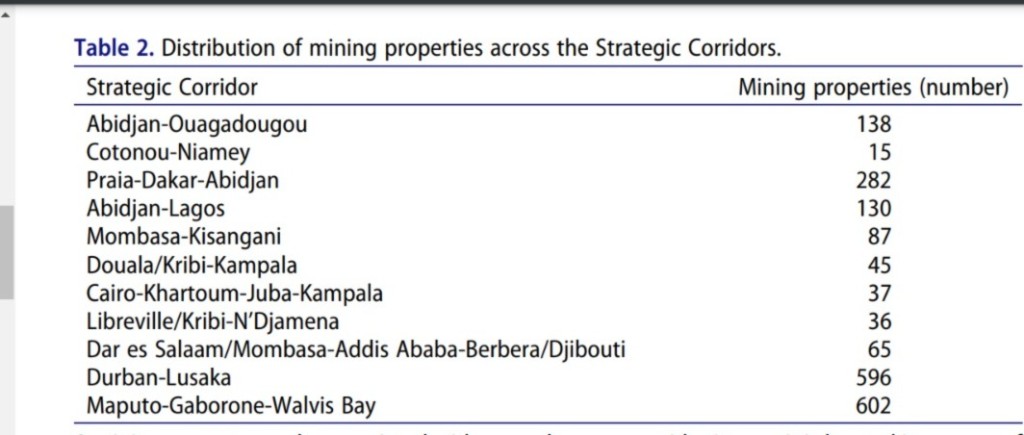
Table 2. Distribution of mining properties across the Strategic Corridors
Table 2. Distribution of mining properties across the Strategic Corridors — Durban–Lusaka (596) and Maputo–Gaborone–Walvis Bay (602) dominate.
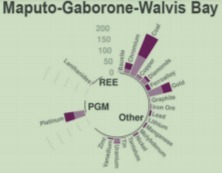
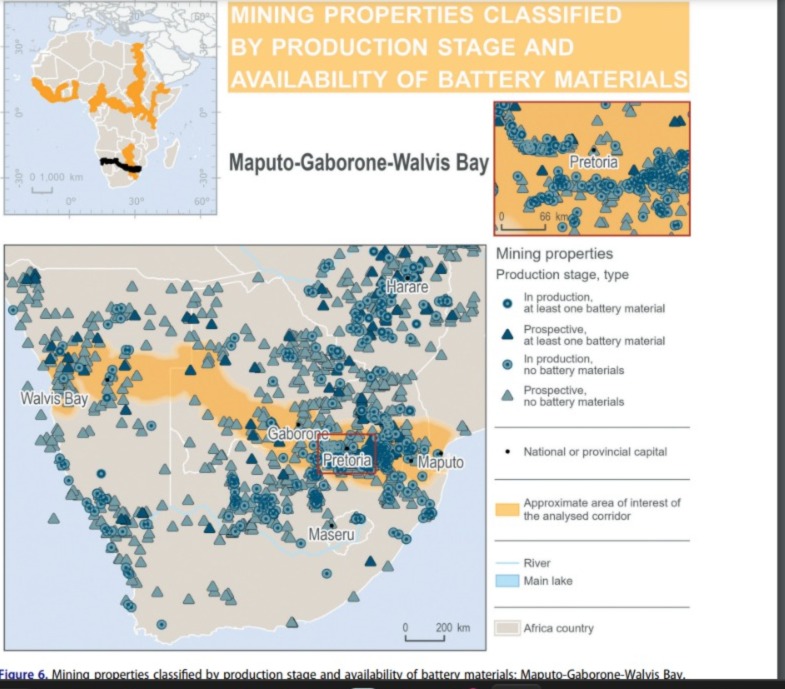
Mining properties and battery materials along Maputo–Gaborone–Walvis Bay
Figure 6. Maputo–Gaborone–Walvis Bay — mining properties by production stage and battery materials.
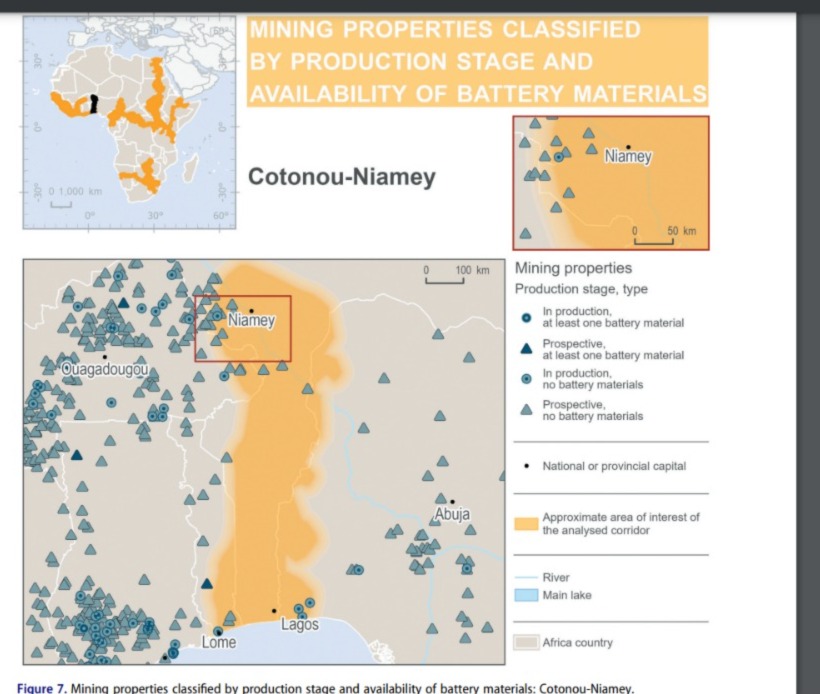
Mining properties and battery materials along Cotonou–Niamey
Figure 7. Cotonou–Niamey — mining properties by production stage and battery materials.
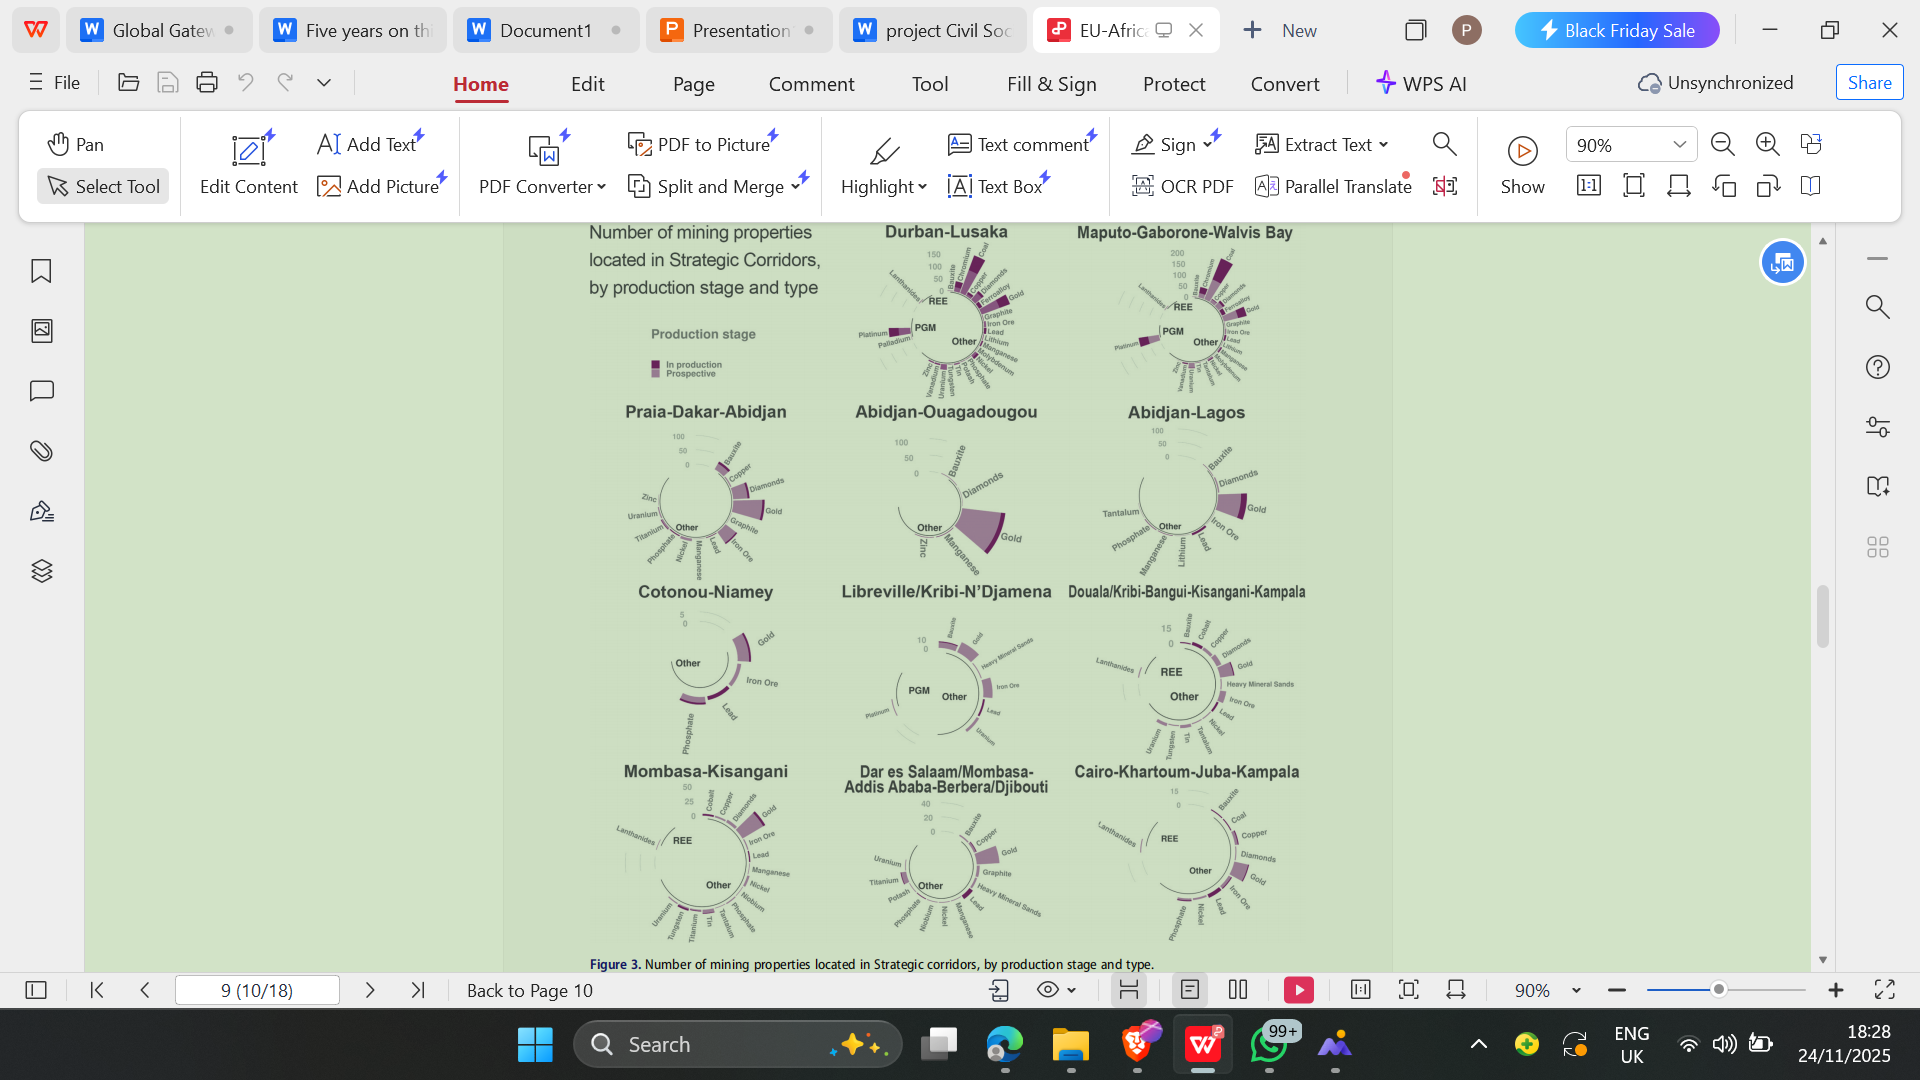
Number of mining properties located in Strategic corridors, by production stage and type
Figure 3. Number of mining properties located in Strategic corridors, by production stage and type.
The 140 indicators

The measures that decided which corridors mattered

A shortlist built from 140 quantitative indicators — including mineral resources, ports, railways, roads, renewables, protected areas and conflict. Six of them reveal what the exercise was really weighing.

01

How much the region trades with the EU — absolute and relative EU exports and imports.

02

Estimated availability of mineral resources, expressed as the number of mining locations.

03

The share of the corridor projected to be used for agriculture by the year 2050.

04

World Bank versus Chinese financing of projects in the corridor between 2004 and 2014.

05

Connections between container ports in the corridor and container ports inside the EU.

06

The number of violent events, demonstrations and non-violent actions from 2015 to January 2021.